Invocations
Purpose
- Allow build maintainers to view current activity on the cluster.
- Provide an easy way for engineers to navigate to their invocations.
- Allow build maintainers to identify troublesome invocation patterns.
Page sections
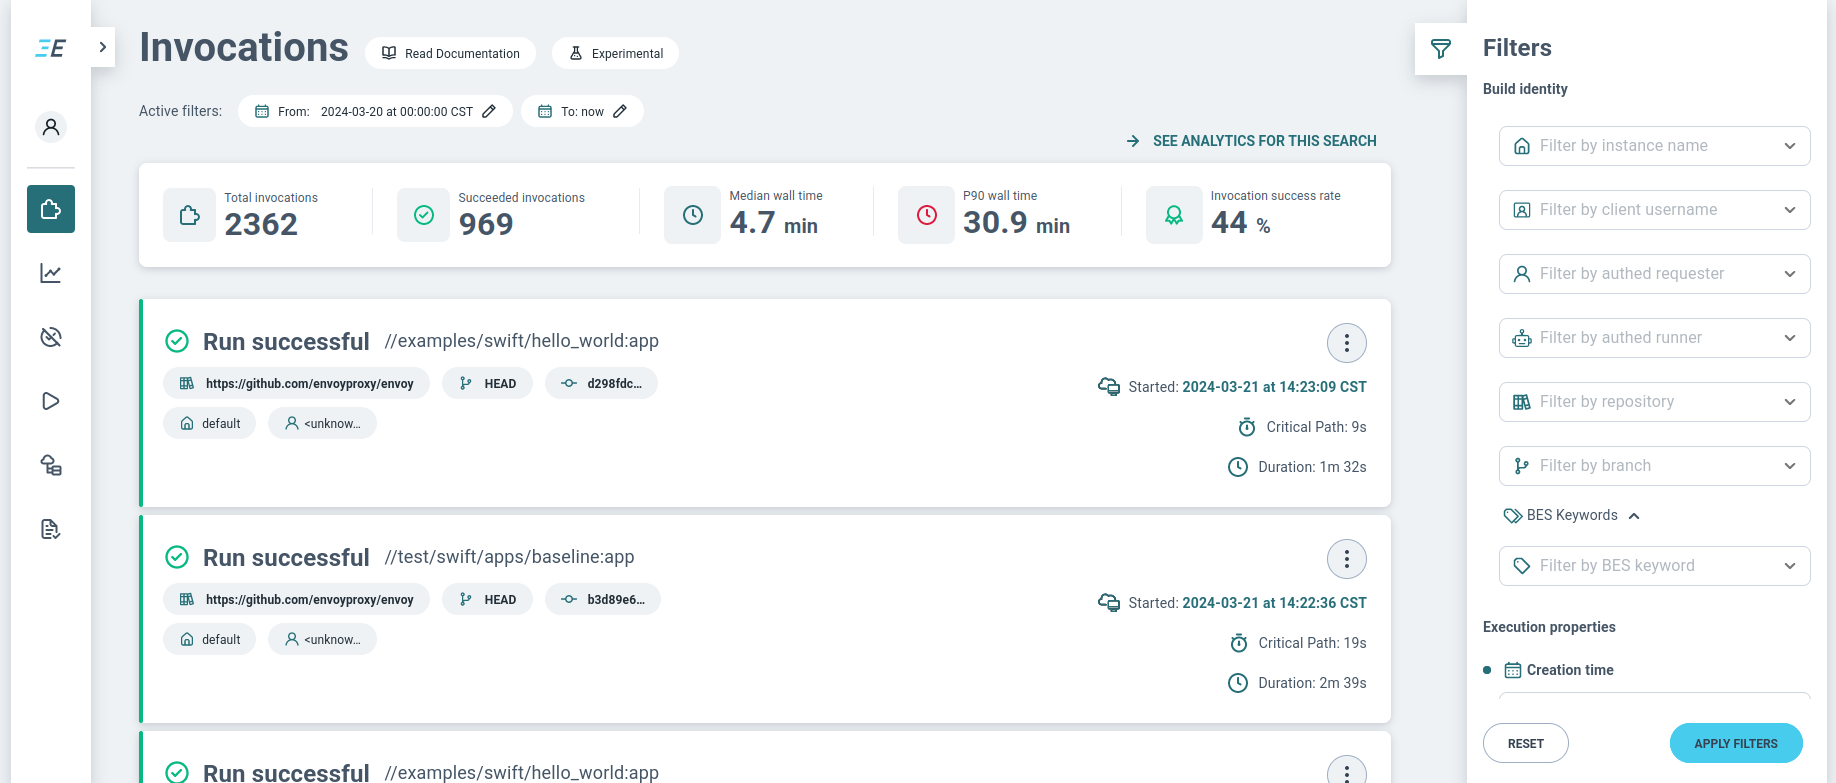
Active filters
The Invocations page lists the invocations that match the active filters.

The default filters narrow down the results to invocations that were started within the last month.
If the active filters allow all invocations up to “now”, then new invocations will be fetched and displayed while the page is open. This is the case when the default filters are applied.
You can refine which invocations are shown by adjusting the active filters. This can be done in a limited way by interacting with the chips. For full control, use the Filters sidebar on the right.
Statistics
Above the list of invocations, some statistics on all the invocations matching the currently active filters are displayed.

If the status of a running invocation changes or new invocations appear that match the current search filters, then this card may become outdated. In that case, the statistics card receives a dimmed appearance and a button that allows you to refresh the statistics appears.
Statistics limited to 10,000 invocations
The statistics shown summarize at most 10,000 invocations. If more invocations match the active filters, only the 10,000 most recent invocations contribute to the presented data.
Search results
The invocations page lists the invocations that match the active filters. The list of invocations is sorted by creation time in descending order, so that the most recently started invocations are listed first.
The list is loaded lazily, i.e., as you scroll towards the bottom of the page, more results will be fetched and displayed.
If the active filters allow all invocations up to “now”, then new invocations will be fetched and displayed while the page is open. These invocations are added to the top of the list to preserve the sorting order.
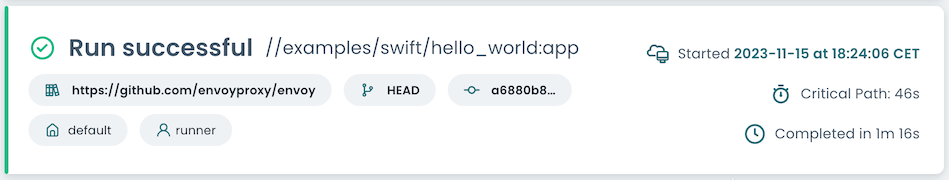
Invocation summary
Each invocation that matches the active filters is represented by a card that includes a short summary of that invocation.
You can click on any area of the card to go to that invocation’s details page, which includes all of the invocation’s details.
Execution status
An invocation’s summary includes its execution status. Still-running invocations are also shown, and their status and related information are updated on the fly.
Target patterns
The invocation’s target patterns are listed, potentially in an abbreviated form. If the invocation has multiple target patterns, only the first pattern is listed, followed by a “[...]”. The full list of target patterns can be viewed on the invocation’s details page, which you can visit by clicking anywhere on the summary card.
Build identity
To more easily identify invocations, some of the invocation’s build identity properties are listed. You can filter invocations by these properties using the Filters sidebar on the right. The icons will match those used in the filter controls.
You can find out how to add build identity information to your invocations here.
Timing information
To more easily identify invocations, some of the invocation’s execution properties are listed. You can filter invocations by these properties using the Filters sidebar on the right.
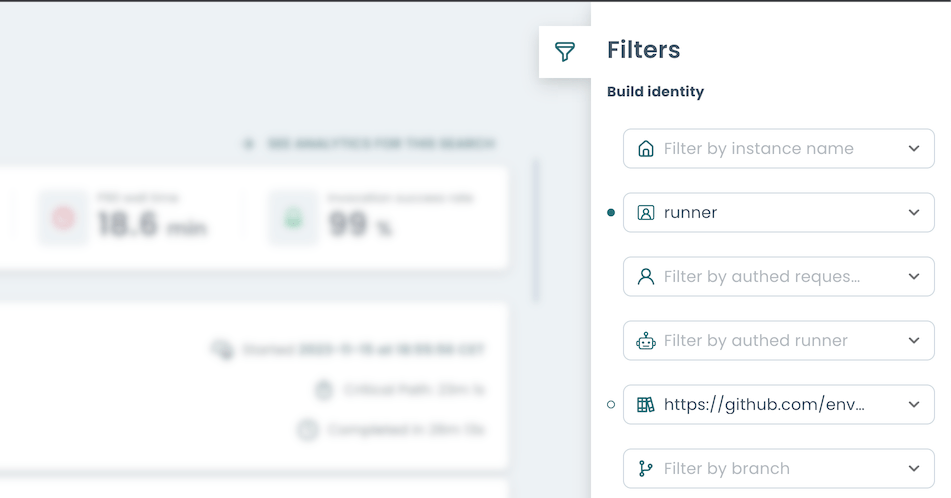
Filters sidebar
You can restrict which invocations are shown by adjusting the filters in the right sidebar.
By default, the active filters narrow down the results to invocations that were started within the last month.
Some filters have a mark on the left. Active filters are marked with a filled circle, pending filters are marked with an outlined circle. Use the Apply button to change the active filters.
The Reset button resets the active filters to the default filters.
Build Identity filters
These filters allow you to refine the list of invocations by specific metadata.
You can find out how to supplement an invocation with data such as the repository, branch, and BES keywords here.
Execution Properties filters
These filters restrict invocations by an invocation’s execution properties, such as when the invocation was started, what its status is, or (for completed invocations) their wall time and critical path duration.
Known Issues
- The Invocations page uses a search index internally. Only invocations that are in this index can be listed. Currently, invocations are marked for indexing when they are created. This means that all invocations that were started before this feature was enabled are never indexed.
- The statistics shown summarize at most 10,000 invocations. If more invocations match the search filters, only the 10,000 most recent invocations contribute to the presented data.
- Some cluster upgrades reset the search index. This means that all invocations created before the upgrade are no longer indexed, and can therefore not be listed on this page. Note that the BEP streams of the invocations are still stored and can be accessed by visiting the invocations’ details pages directly, but the data is no longer available to the Invocations page.
- If the invocation status filter is set to “Running” and an invocation completes, then the search results do not remove the completed invocation from the search results.