Action Details
The action details page presents information on an action requested by Bazel. This can help debug actions that are executing remotely.
The page lists all the inputs an action gets before execution. The data is retrieved from the cluster's CAS (content addressable storage).
It may also include the result of the action when it was executed on the cluster.
Inputs to an action
An action receives the following inputs before execution and are listed on the page:
- Properties section
- Platform properties
- Whether the action result should be cached
- Action timeout
- Command section
- Command arguments
- Environment variables set during command execution
- Expected output files and paths
- Input Tree section
- The input tree, the virtual file system available to the action on
execution
- Overall statistics
- A file browser that gives access to details about the input files, including an option to download the files
- The input tree, the virtual file system available to the action on
execution
The data displayed is based on the following remote execution protobuf messages:
- build.bazel.remote.execution.v2.Action
- build.bazel.remote.execution.v2.Command
- build.bazel.remote.execution.v2.Directory (for the input tree)
Result of executing an action
If the action was executed remotely and the execution result is available, the Action Details page will include two further sections: Action Result and Outputs. These provide the following data:
- Action Result section
- The exit code, stdout and stderr
- For which invocation, target and configuration the action was executed
- The action's virtual execution duration
- Outputs section
- The generated outputs, presented in a file browser that gives access to details about the output files, including an option to download the files
The data displayed is based on the following remote execution protobuf message:
This message may be retrieved from the Action Cache or directly from the CAS.
Results from the Action Cache
When reaching the page through the /actions/cache path, e.g.
https://demo.cluster.engflow.com/actions/cache/default/0b[...]f0/160, the
result - if available - is fetched from the action cache. This page can be used
to investigate which result is currently stored in the Action Cache for a
specific action.
The result of actions that failed or are marked as do_not_cache are never
written to the Action Cache, so this endpoint never shows a result for such
actions. However, historical results may be
available.
Legacy path
This page was previously served under the path /action. If your cluster
is running an older version, it may still be using the old path.
Historical results from the CAS
EngFlow saves execution results for all actions, even if they fail or are marked
as do_not_cache. These results can be accessed through the
/actions/executions path, e.g.
https://demo.cluster.engflow.com/actions/executions/SOME-EXECUTION-ID.
Historical results can help debug failed actions and inspect the performance and inputs and outputs of actions.
Legacy path
This page was previously served under the path /invocation/action. If your
cluster is running an older version, it may still be using the old path.
Accessing the page
Build and Test UI
The Build and Test UI may include links to the Action Details page if there are strong enough signals that investigating the action details might be helpful.
Autochecks
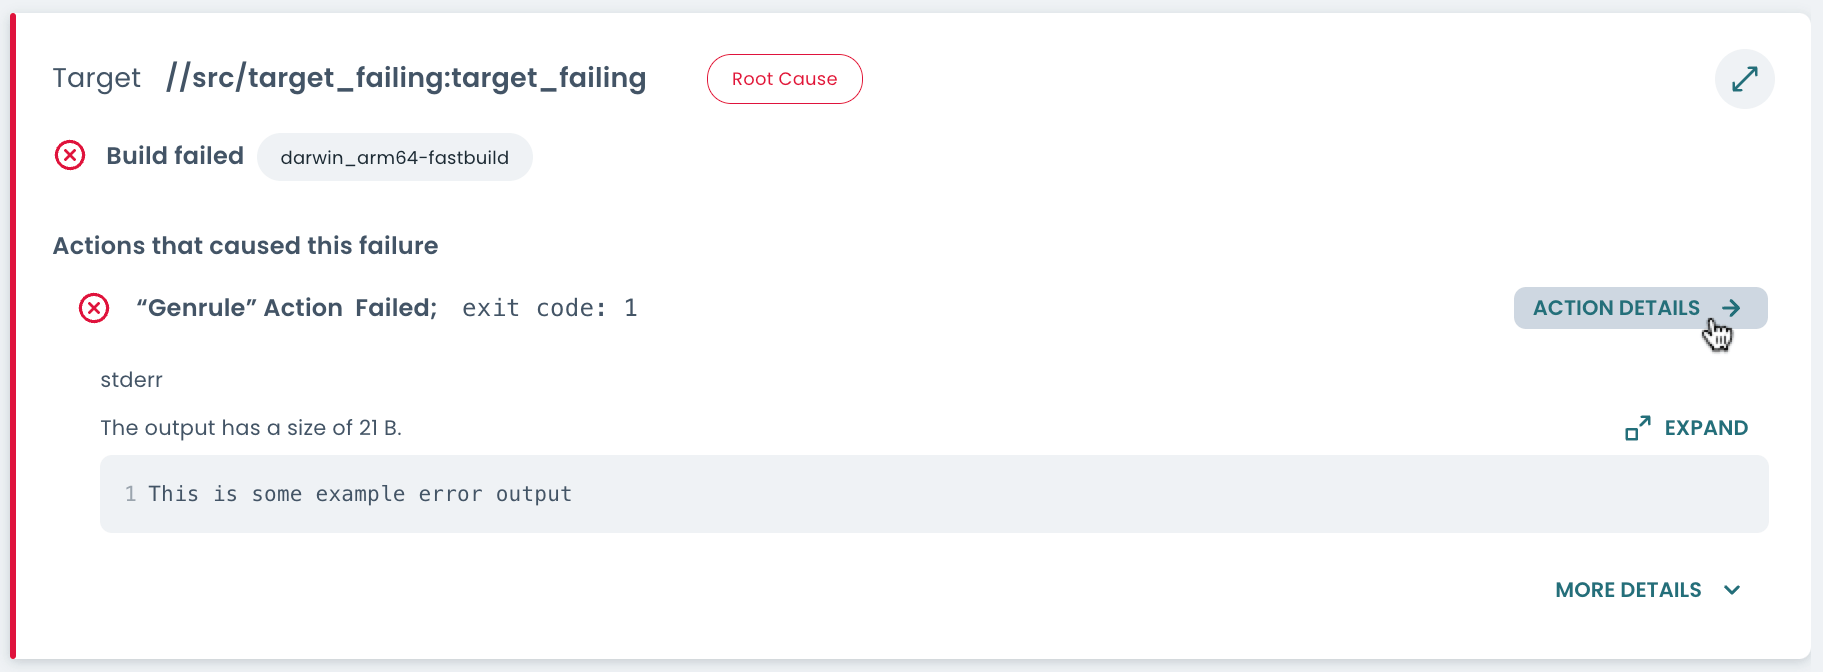
If autochecks are enabled, the target details may include a link to the action details of the action(s) that caused the target to fail.

Invocation analysis
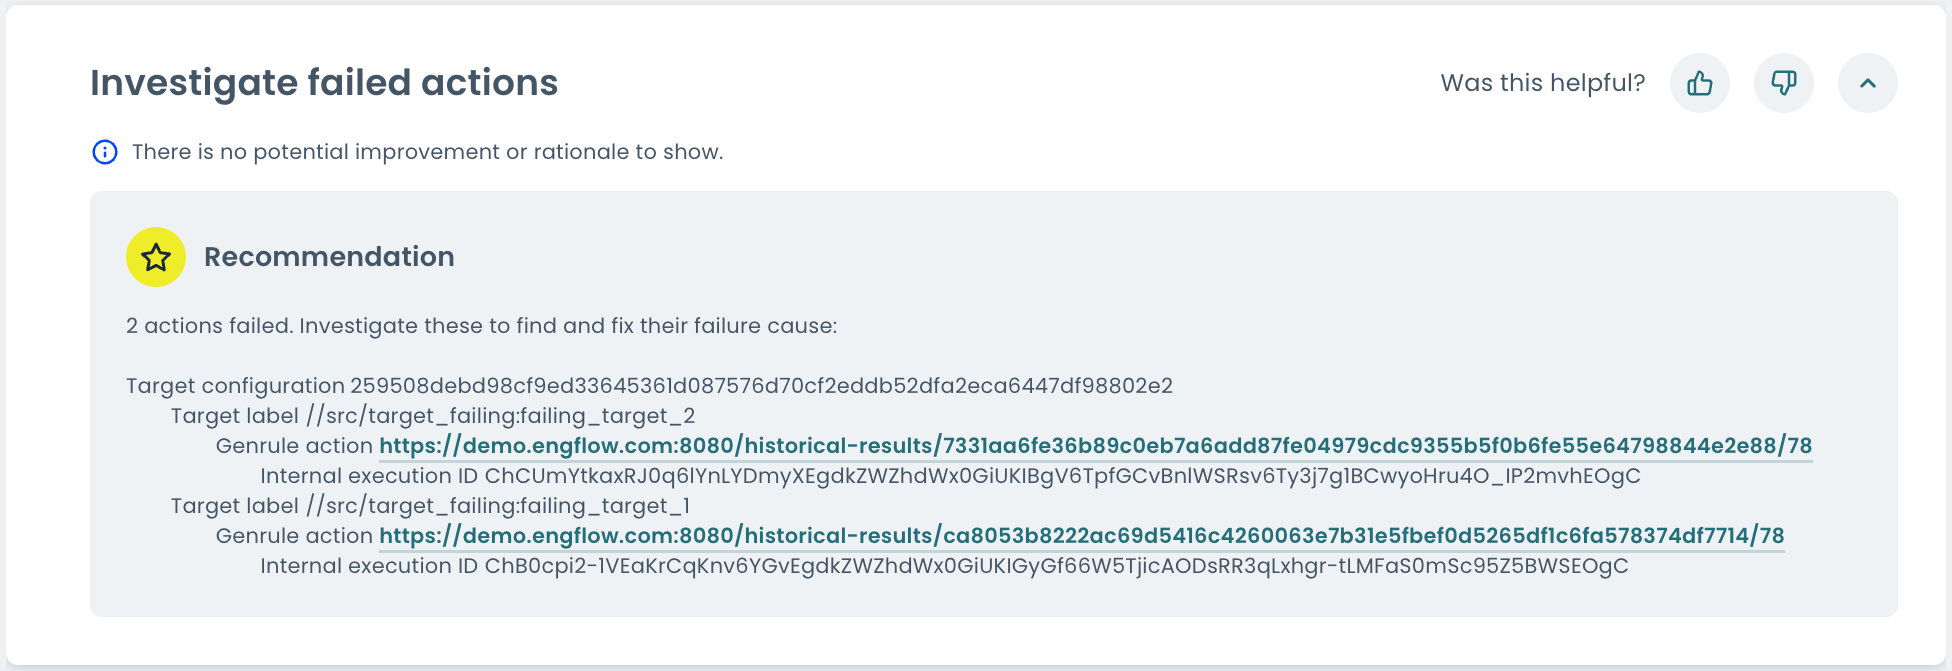
If invocation analysis is enabled, there may be a suggestion to investigate failed actions with links to the action details.

Console output
If configured, the link to the historical results page may be output by Bazel
when an action fails. See the example below, in particular the Execution
result link:
Configuration
When setting the server-side flag
--experimental_historical_result_url, the EngFlow cluster reports the
link to the Bazel client. The Bazel client then prints out the link to the
console in case of a failure.
Since Bazel 6.0.0, it is possible to configure when the Bazel client prints
out this message, see
--remote_print_execution_messages for details.
EngFlow profile
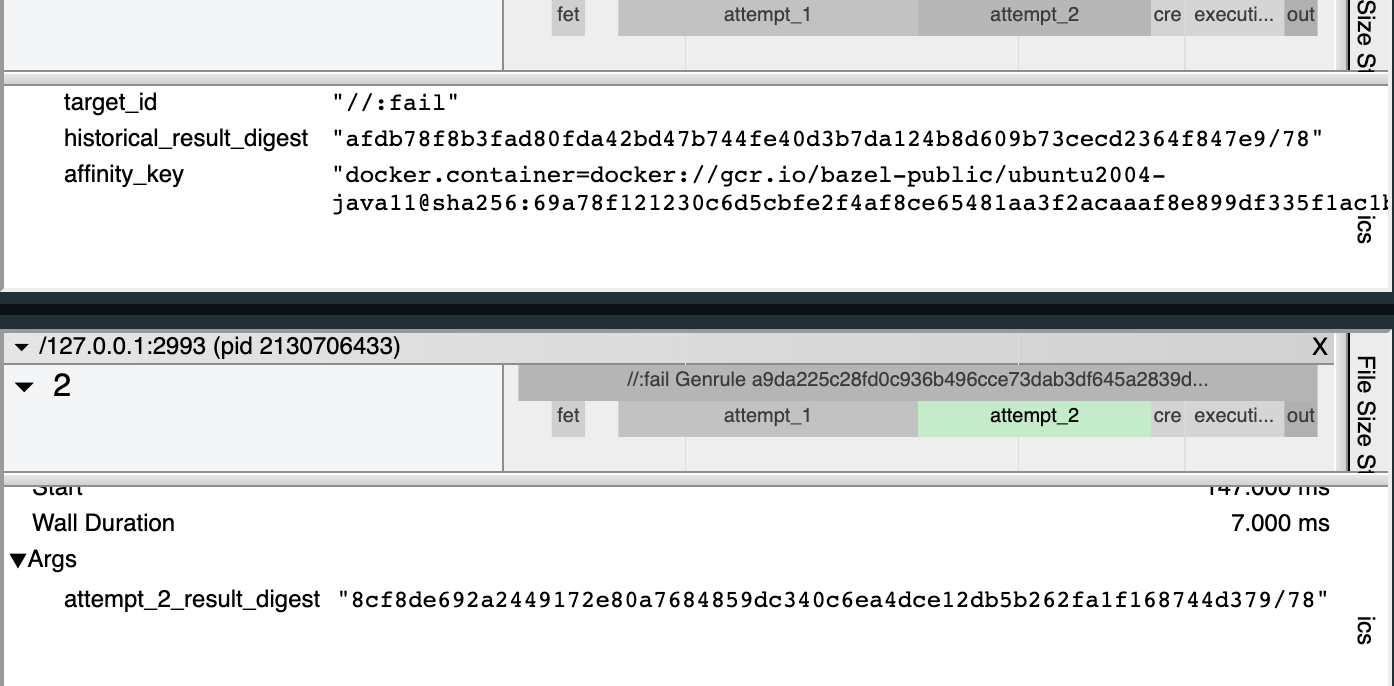
The EngFlow profile, which can be accessed in the Profiles section of the Invocation Details page, provides granular insight into the server-side events for each action that ran remotely.
It may include the following entries that can be used to construct the URL to the Action Details page for a specific action:
action_digest:${cluster_endpoint}/actions/cache/default/${action_digest}for results from the Action Cacheinternal_execution_id:${cluster_endpoint}/actions/executions/${historical_result_digest}for historical results
Legacy paths
The Action Cache results, now served under the path
/actions/cache/default/${action_digest}, were previously served under the
path /action/${action_digest} or /action-cache/${action_digest}. If your
cluster is running an older version, it may still be using the old paths.
The screenshot below shows some relevant entries of an EngFlow profile when
viewed using chrome://tracing:
Digests in the EngFlow profile

Purpose
- Allow build maintainers to debug build configuration errors.
- Allow engineers to debug code errors in further detail.
Known Issues
- The file browser currently does not include symbolic links.