Analytics Page
Experimental
This feature is experimental. It may be incomplete or unstable, and may be removed in the future.
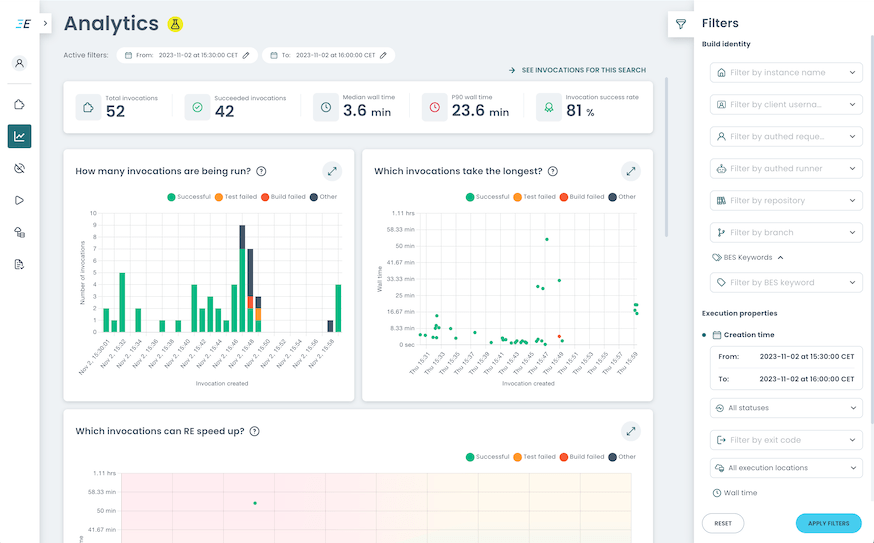
The Analytics page gives an aggregated view over the invocations listed on the Invocations page. As such, it possesses the same filtering capabilities.
Purpose
- Allow build maintainers to view common pitfalls and chances for improvements across a series of invocations.
- Allow build maintainers to detect if any of their build issues can be resolved using remote execution.
- Allow build maintainers to identify build performance regressions.
Page sections
Active filters and Filters sidebar
The Analytics page uses the same filters as the Invocations page.
For details, see the Invocations page’s documentation on active filters and Filters sidebar.
See invocations for this search
View the list of individual invocations that are aggregated on this page by visiting the Invocations page.
Statistics
Above the charts, some statistics on all the invocations matching the currently active filters are displayed.
Statistics limited to 10,000 invocations
The statistics shown summarize at most 10,000 invocations. If more invocations match the active filters, only the 10,000 most recent invocations contribute to the presented data.
Charts
Multiple charts highlight different properties about the matching invocations.
The charts have interactive elements. For example,
- for all charts, hover over the ? to find out more about the chart;
- for all charts, you can copy a link to that specific chart -- the link will open the chart in full-screen mode;
- within bar charts, click on a bar to narrow the invocation search accordingly;
- within scatter charts, click on the dots to either view a list of invocations included in that dot, or, if the dot represents just one invocation, view that invocation’s details page;
- if a scatter chart cannot be shown due to the search being too wide, you can narrow the search.
Known Issues
- The Analytics page uses a search index internally. Only invocations that are in this index can be aggregated. Currently, invocations are marked for indexing when they are created. This means that all invocations that were started before this feature was enabled are never indexed.
- The Analytics page is restricted to 10,000 invocations. If more invocations match the search filters, only the 10,000 most recent invocations contribute to the presented data.
- Some cluster upgrades reset the search index. This means that all invocations created before the upgrade are no longer indexed, and can therefore not be aggregated on this page. Note that the BEP streams of the invocations are still stored and can be accessed by visiting the invocations’ details pages directly, but the data is no longer available to the Analytics page.