Invocation Details
This page shows all the details of a single invocation. You can reach it:
- through the invocation link Bazel provides at the start of the build, or
- via the Invocations page by clicking on an invocation.
Purpose
- Allow engineers and build maintainers to identify and replicate various kinds of issues, regressions and performance problems in an invocation.
- Allow engineers to easily access logs and other stored artifacts.
Page sections
Pending Data Warning
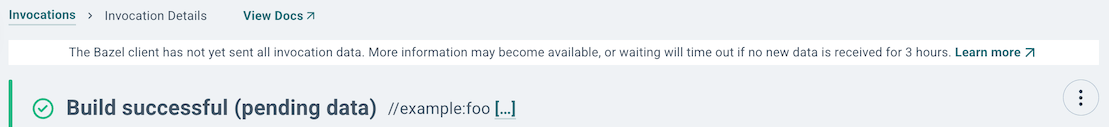
The data shown in the Build and Test UI is based on the build events that
the Bazel client streams to the cluster's BES endpoint, as specified by the Bazel flag
--bes_backend. If an invocation's stream did not include the final lifecycle event yet, a
warning may be shown.
There are different reasons why such an event was not yet sent, such as waiting for a large file to be uploaded, or the network connection being slow.
However, if this warning is shown for an extended time, this may indicate a non-recoverable problem
in the transfer. For example, if the invocation sets --bes_lifecycle_events=false, then no
lifecycle events are published, although our service depends on these. If the invocation sets
--bes_upload_mode=fully_async, then the stream may be aborted before sending all the data:
- if uploading takes more than 5 seconds before Bazel is shutdown or another invocation is started, or
- if the Bazel client is running on a short-lived machine (e.g. a CI image) that is terminated as soon as the Bazel invocation exits.
Similary, setting a timeout via --bes_timeout can lead to incomplete streams.
If the cluster detects that the stream was aborted before receiving the final lifecycle event, then the invocation is assigned the status "stream incomplete". That status is also assigned, if no new events are received on the stream for 3 hours. In that case, the stream is cancelled by the cluster to terminate open connections.
Summary
This section summarizes the invocation. It displays similar information to the data shown in the search results cards on the Invocations page.
You can find out how to add supplemental data to your invocations here.

The menu on the right provides further options, such as copying a textual summary of the invocation or a link to the page.
Tabs
The main content of this page is split into multiple tabs, each of which has a different focus.
Highlights
The highlights show you the most useful widgets from the other tabs aggregated into a single view.
This tab often shows you everything you need to know about a build, such as failure details on a failed build, or performance data on a successful build.
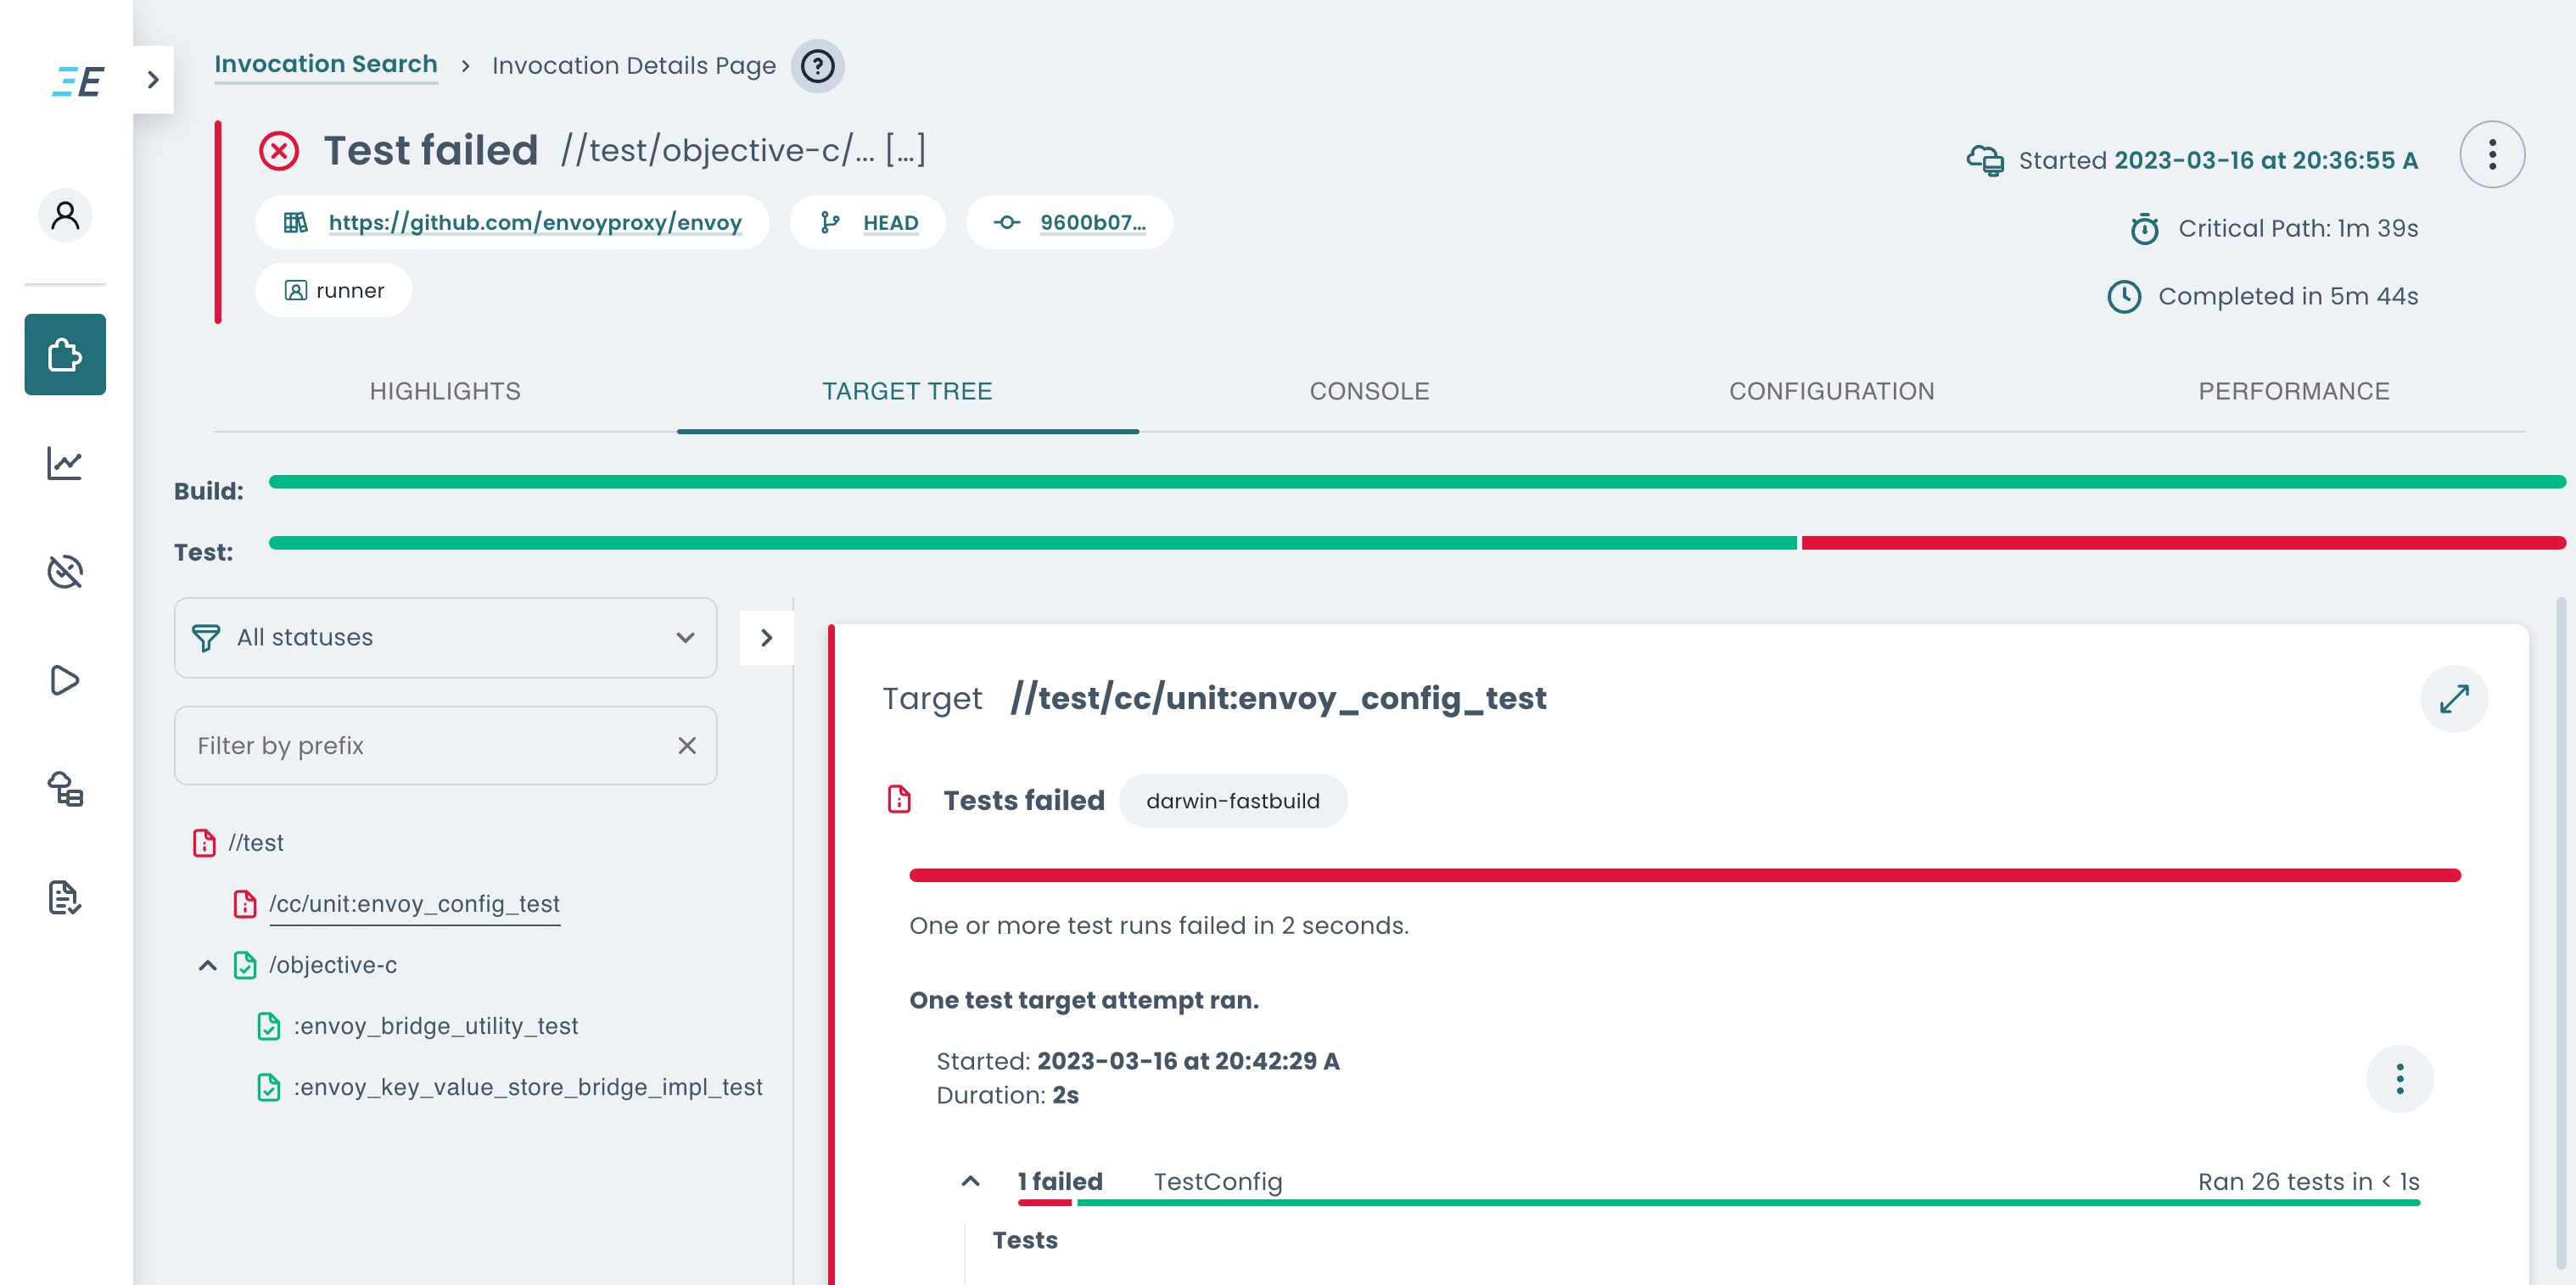
Target tree
This tab is split into two columns.
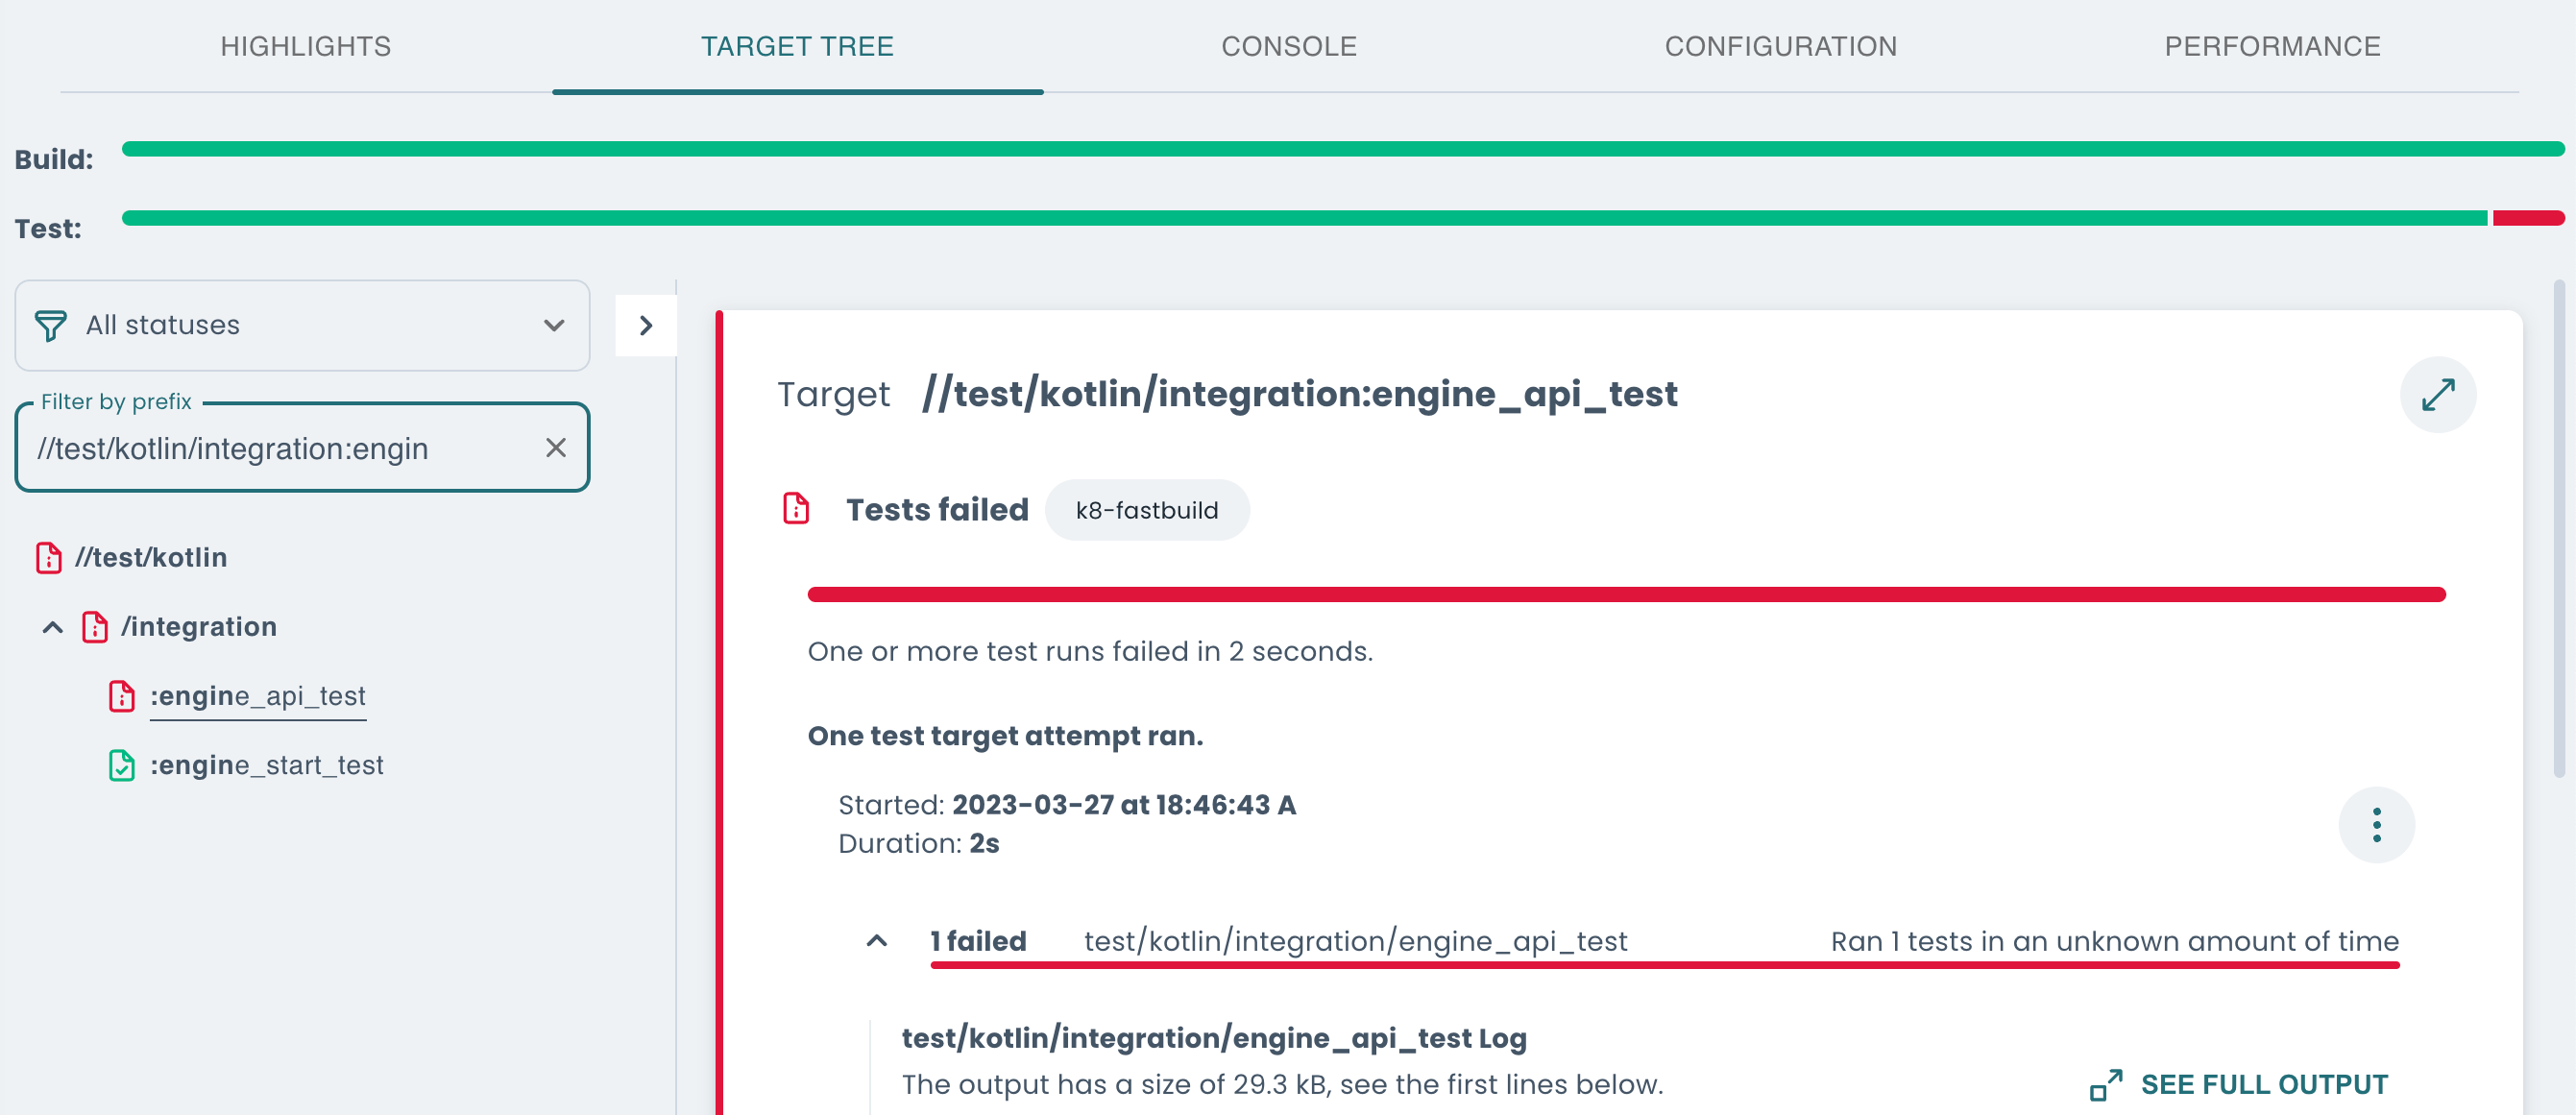
List of targets
On the left, all the targets are listed as a tree that matches the package structure. The inner nodes represent packages, whereas the leaves represent targets.
The section can be resized or fully expanded to facilitate browsing deep package paths.
You can filter the tree structure by target status (failed, in progress,
not built, succeeded) and target labels (prefix search).
Depending on the status of the invocation, some filters may be applied by default. For example, if a completed invocation has unsuccessful targets, then all successful targets are filtered out. Similarly, successful targets are filtered out while an invocation is still running.
These default filters are applied to help you discover the most relevant information. You can adjust the filters at any time to change which targets are listed.
The status icon of an inner node indicates the “worst” status reported within the package the node represents. For example, if a package includes both a successful and a failing target, the directory will be marked as failing.
Target details
Each target listed can be selected. When a target is selected, the target’s details are displayed on the right.
The kind of data shown differs depending on what kind of target is selected. For
example, a build target may list the output files generated and an option to
download them from the three-dot menu. A test target may include the outcome
of various tests, including undeclared test outputs
(outputs.zip) and related logs.
Console
This tab shows the same kind of output a local build shows from the CLI. While an invocation is running, the console output is updated on the fly.
It can be especially useful for invocations that were executed in a CI where the output includes formatting markers, which may make it hard to read in its raw form. This view displays a more readable representation than the raw CI output.
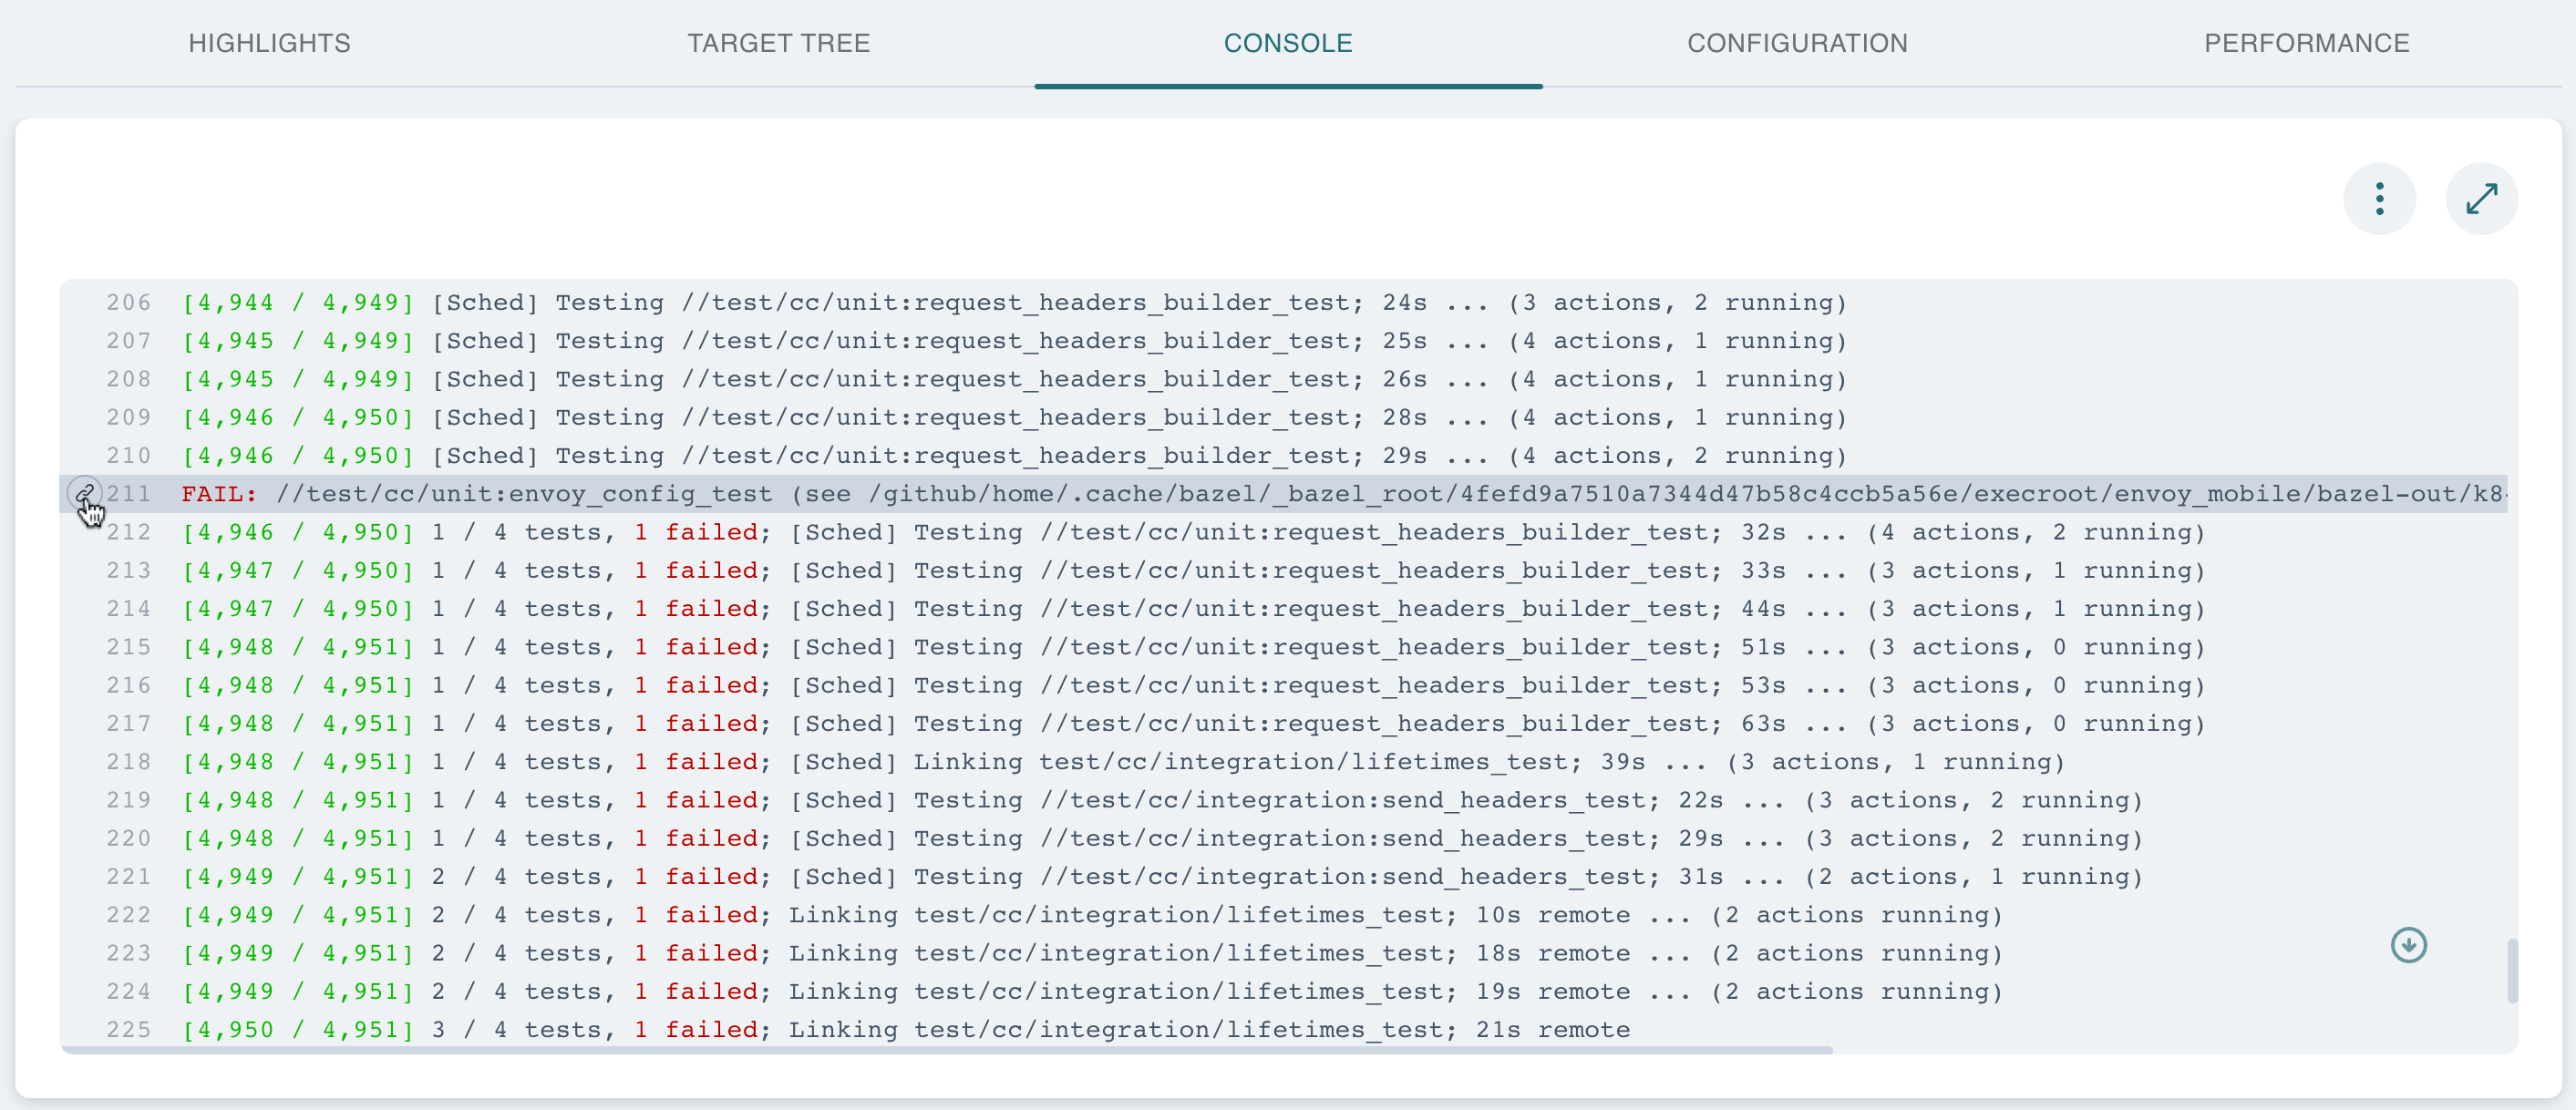
The menu on the right offers options to view or download the raw console output.
You can highlight specific lines of the log by clicking on the line number, and copy a link to a specific line by hovering over the line and clicking on the link icon that is visible to the left of the line number.
Configuration
This section shows different configuration details about the invocation.
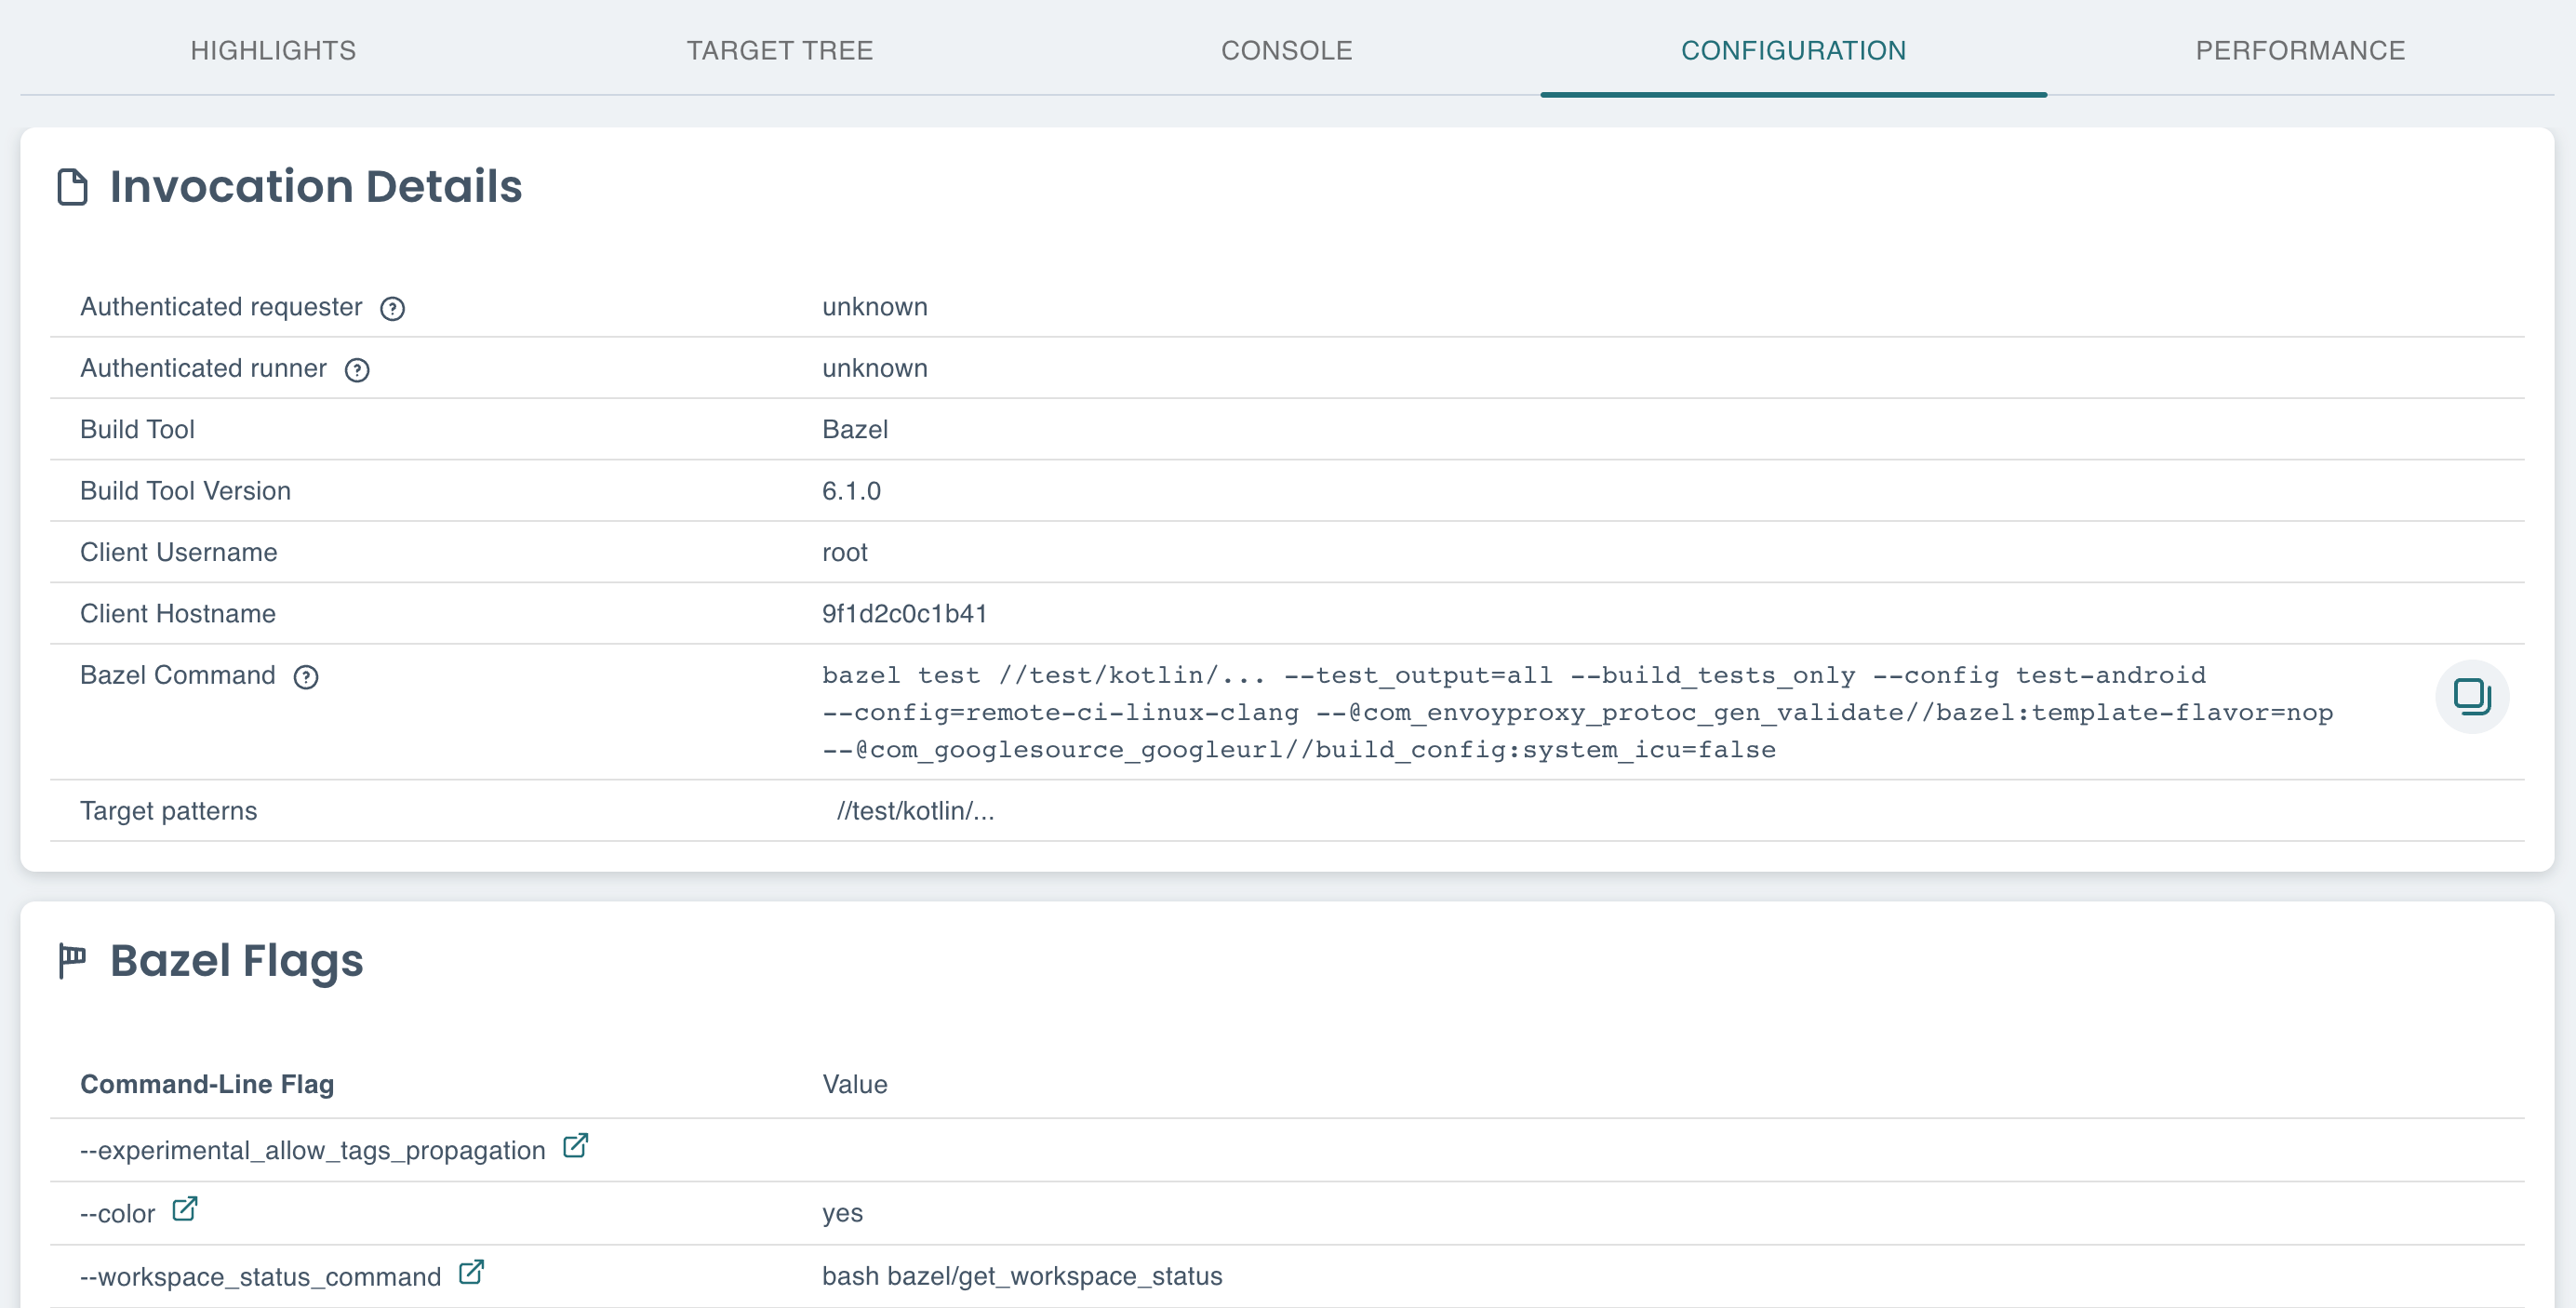
Warning
Note that the Bazel command shown is only an approximation of what was run using known information. The actual Bazel command used is not sent to the server and therefore not known.
When debugging invocations, it can be useful to investigate whether all Bazel
flags have the expected values. This view lists the computed flags. These may be
changed in various ways, such as through a .bazelrc configuration profile or
command-line parameters.
Performance
Access various tools that can help you investigate and potentially improve build performance.
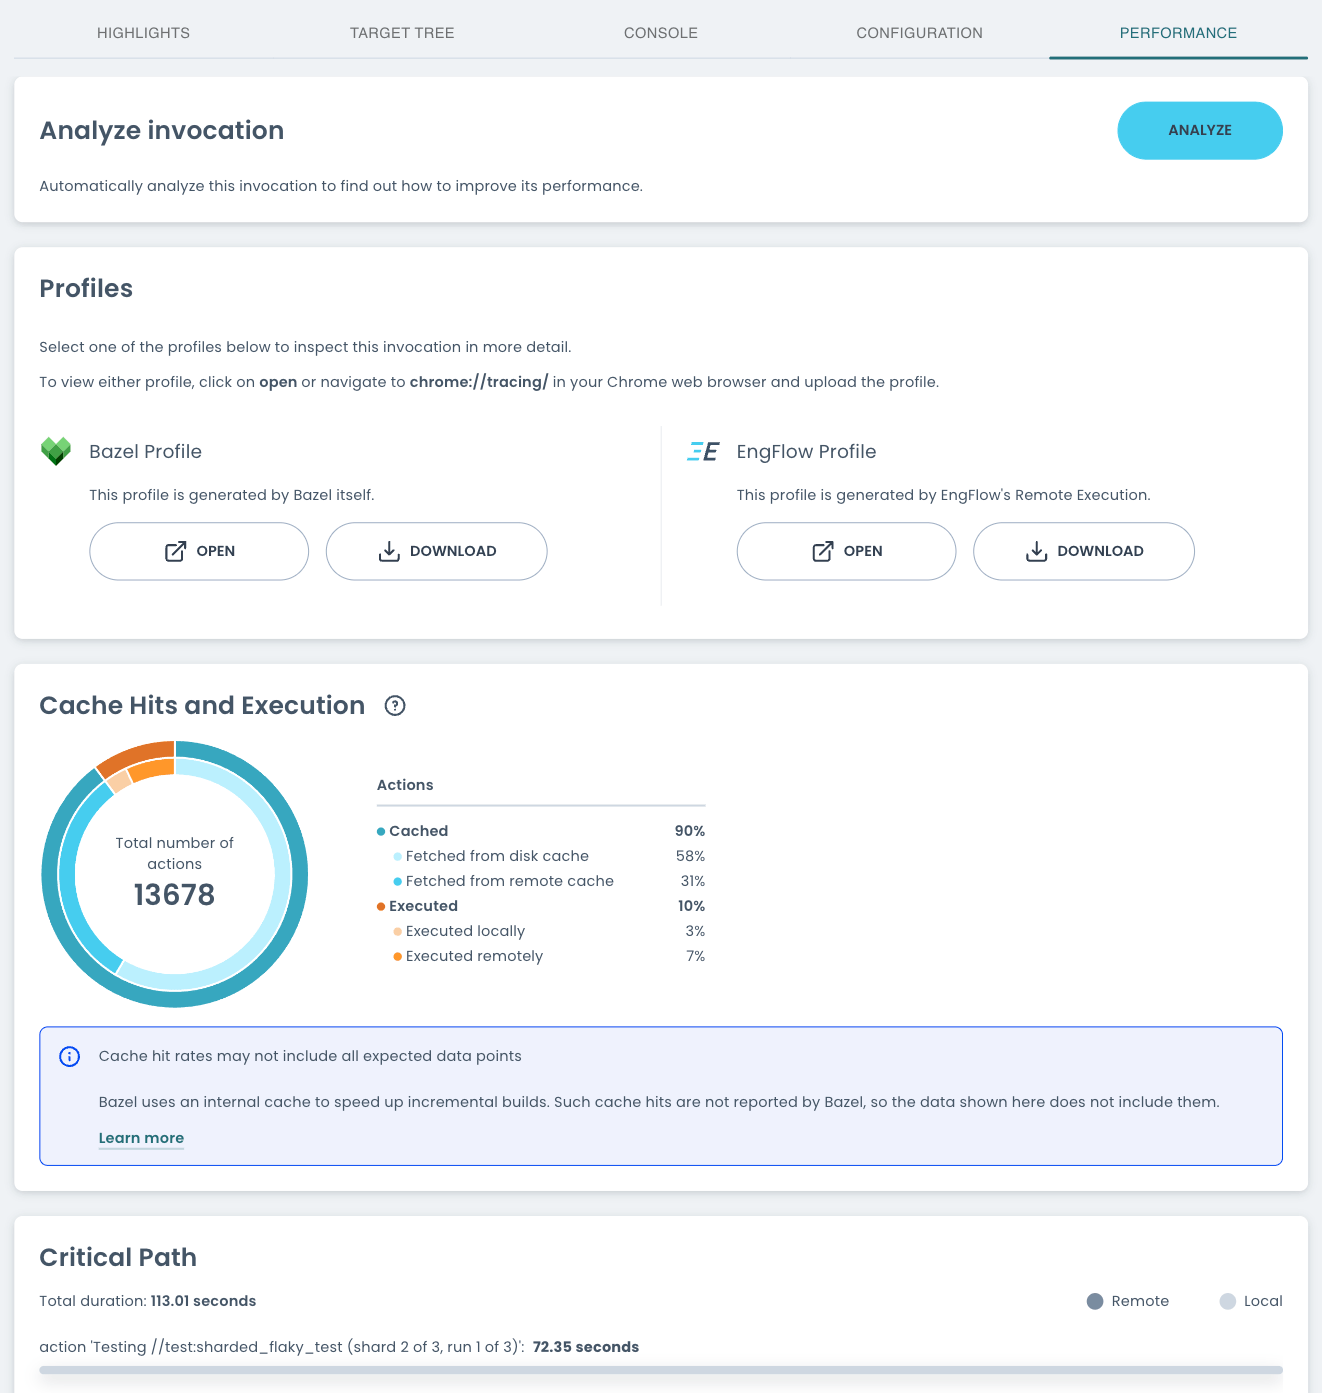
Analyze Invocation
If enabled for the cluster, this section allows you to analyze the available profiles to receive personalized suggestions on how to speed up the invocation further.
This feature leverages the open-source Bazel Invocation Analyzer and includes additional modules to analyze invocation remotely executed with EngFlow further.
Screenshot of analysis results
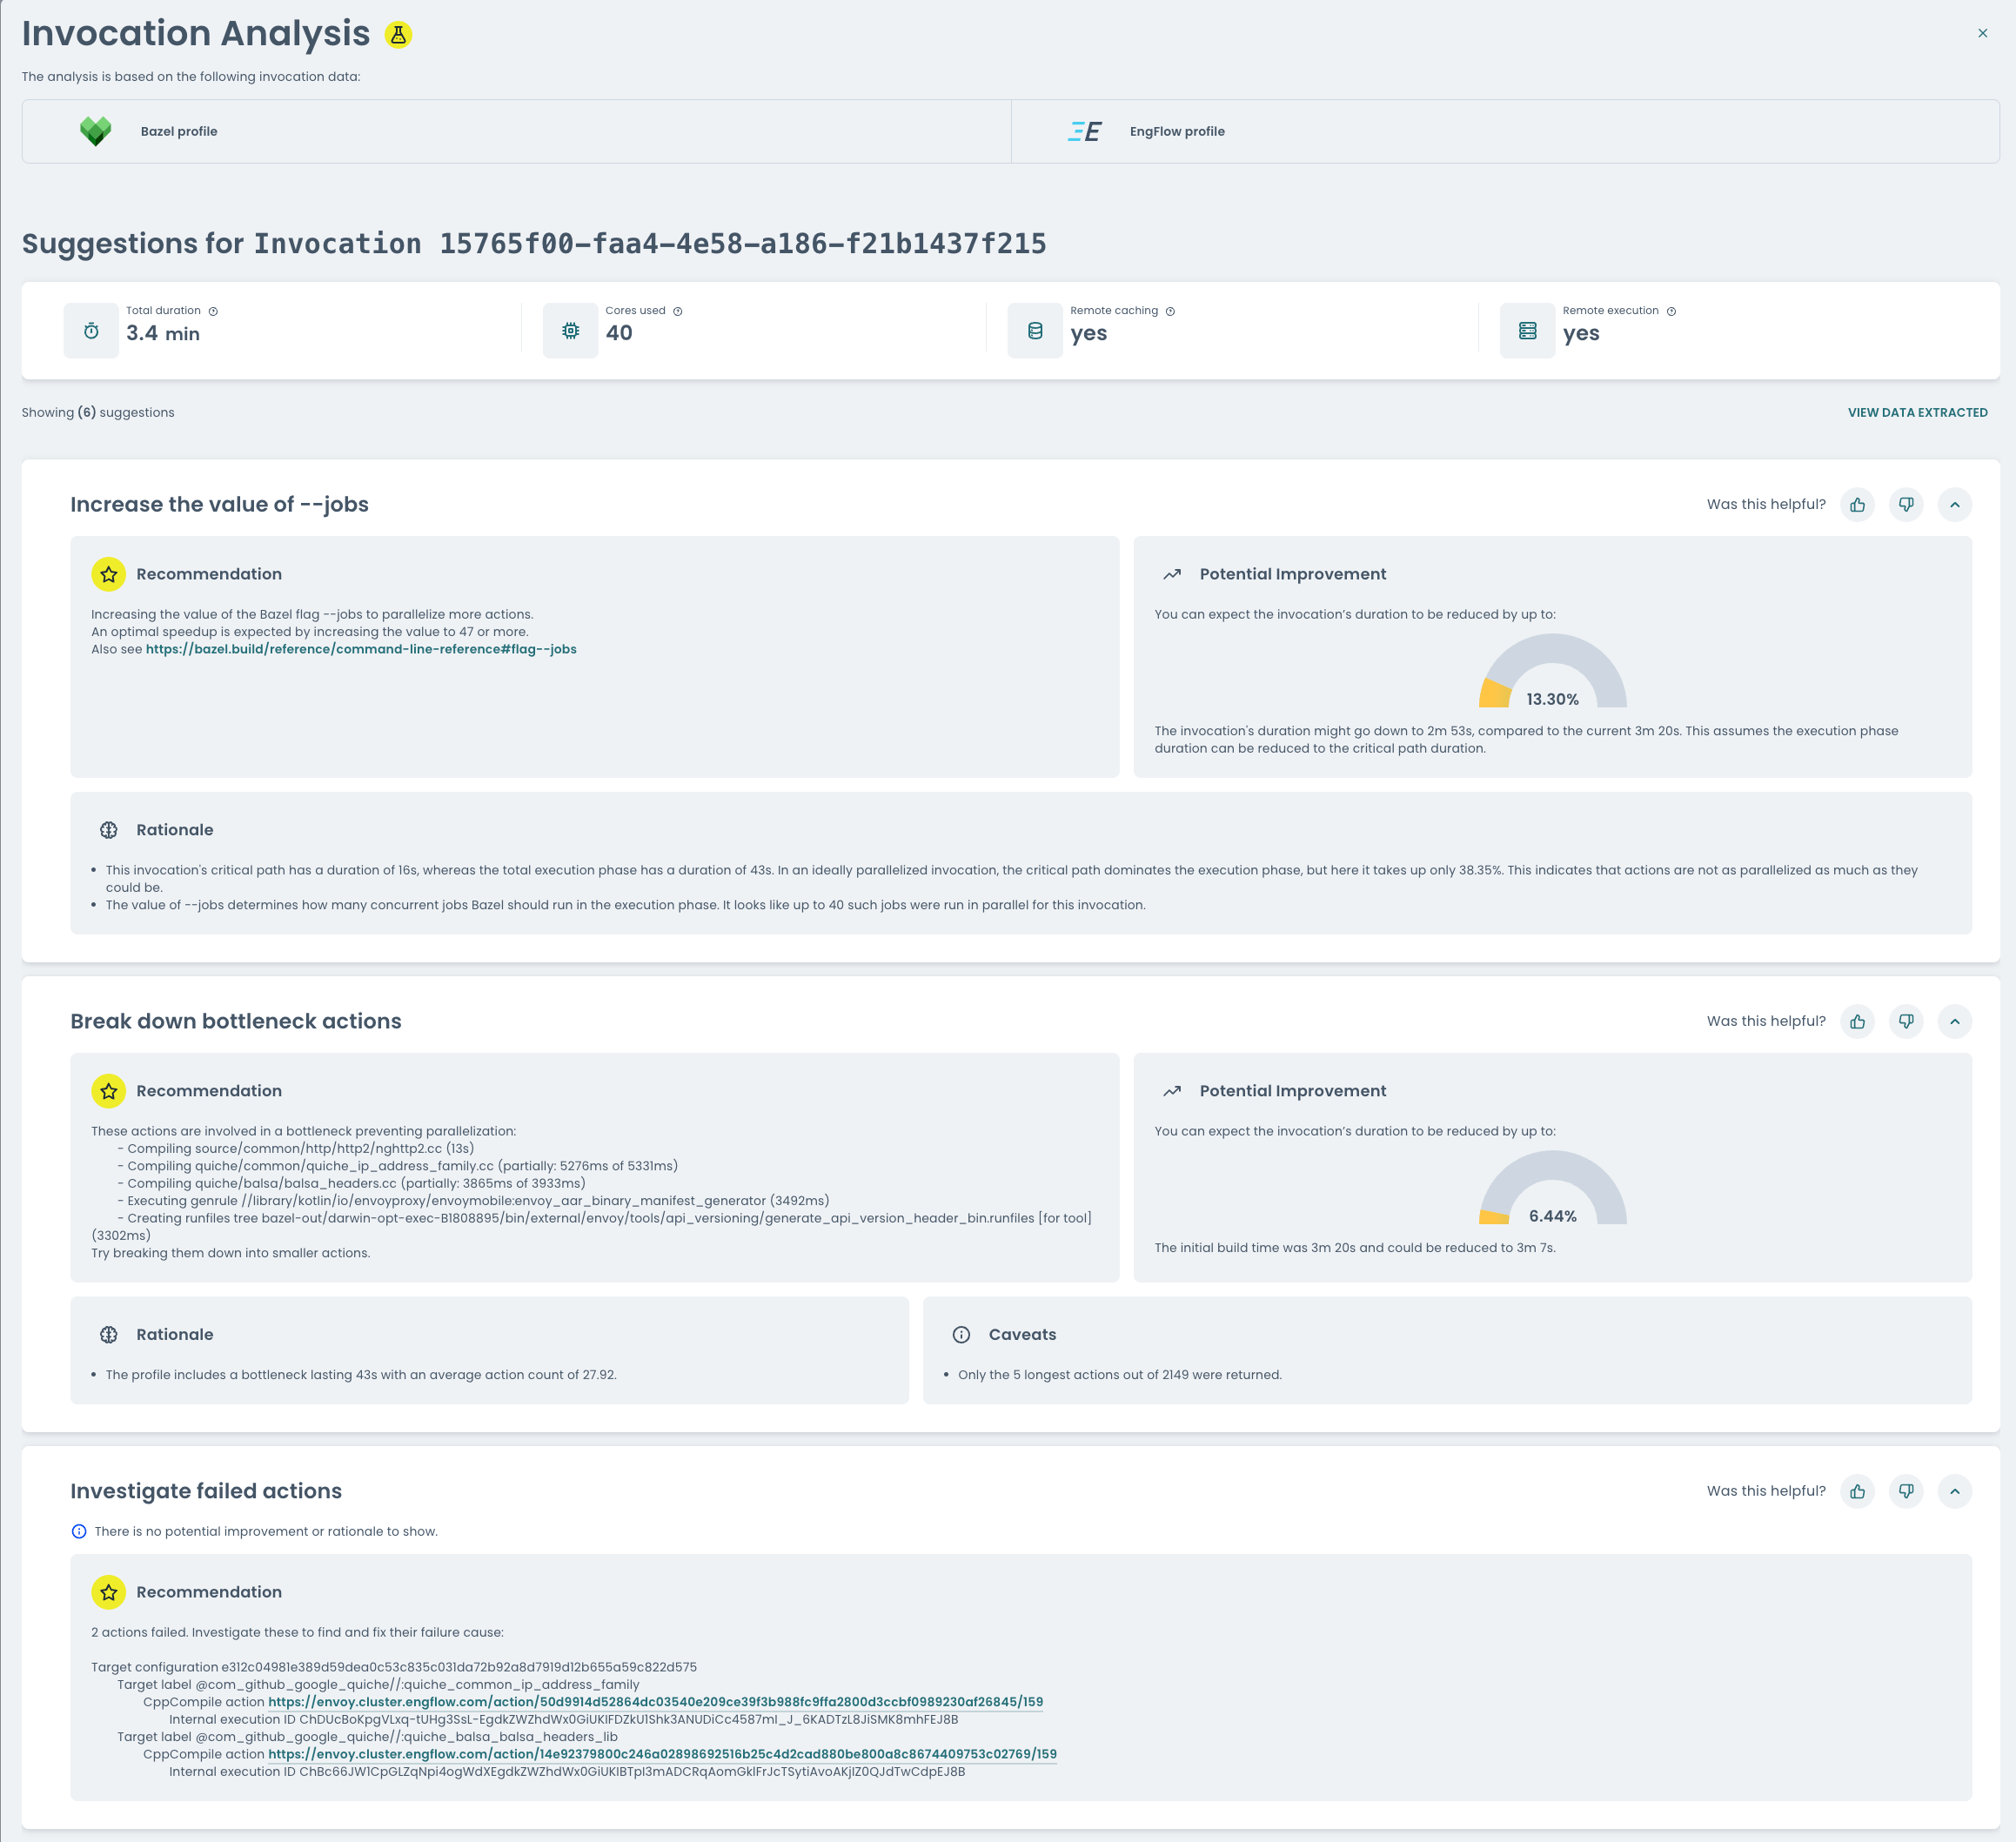
For details on how to interpret the rendered suggestions, see the documentation on viewing the analysis results of the Bazel Invocation Analyzer.
Info
If this feature is not enabled on your cluster, you can download the Bazel profile and analyze it using the Bazel Invocation Analyzer.
Profiles
This section exposes both Bazel’s JSON trace profile and EngFlow’s profile, which tracks the actual remote execution of actions on the cluster.
Both profiles can either be visualized contextually via the Open button or
downloaded for later consumption, e.g. via chrome://tracing or
Bazel Invocation Analyzer.
Info
The Bazel profile is only available once the invocation completes, whereas the EngFlow profile is updated on the fly as actions are being executed remotely.
If the Bazel profile is not available after the invocation has completed, check whether you have set the Bazel flag --experimental_build_event_upload_strategy (for example, to local). It may prevent the Bazel profile from being sent to EngFlow's endpoint, in which case it won’t be available in this section either.
Cache Hits and Execution
The Cache Hits and Execution card displays a breakdown of how Bazel obtained the outputs of actions requested for the build.
Which actions does Bazel request?
When you run Bazel, it determines the action graph that needs to be executed to compute the outputs of the requested targets. It leverages its internal action cache to skip over parts of this graph. This can significantly reduce the number of actions requested and make incremental builds delightfully fast.
Running bazel clean clears the internal action cache.
Bazel determines all required targets when building a target, i.e. the target, and all its direct or indirect dependencies (here: 230). When the internal action cache is empty and no external caches are used, Bazel then requests all actions required for those targets (here: 1655). As new action results are computed, Bazel adds them to the internal action cache.
If you now build the same target again without making any changes in between, Bazel will again determine all required targets (here: 230). However, only 1 action is actually requested, because Bazel determined that all other actions were part of a subgraph that could be fetched from the internal action cache. The one remaining action determines which parts of the action graph can be skipped, so it is always required. Bazel distinguishes such internal actions from actions necessary for computing the requested outputs, and the Cache Hits and Execution card does not include them.
If you make some changes before running Bazel again, the number of requested
actions will usually lie between the two above extremes (clean and fully
incremental). This is also the case if some targets are tagged with
no-cache, even if you make no changes.
A build is considered successful when the outputs of all the actions were successfully obtained either through execution or from a cache. This section gives statistics on how outputs were obtained.
- Actions: The number of actions Bazel requested to build the invocation's targets.
- Cached: Actions where results were fetched from an external action cache,
i.e. a disk cache or remote cache. This excludes internal action cache hits,
as outlined above in the note on "Which actions does Bazel request?".
- Fetched from disk cache: Actions where results were fetched from a disk cache, as configured with the Bazel flag --disk_cache
- Fetched from remote cache: Actions where results were fetched from a remote cache, as configured with the Bazel flag --remote_cache
- Executed: Actions that needed to be executed because they were not fetched
from any cache
- Executed locally: Actions that were executed on the client's machine
- Executed remotely: Actions that ran on the remote execution service specified by the Bazel flag --remote_executor
How can this help me speed up my invocations?
To improve build speed, try the following steps, listed in order of return on effort:
- Reduce the number of requested actions, e.g. by only building the targets needed, or by leveraging the internal action cache.
-
Maximize the number of (disk or remote) cache hits.
- A local cache specified by
--disk_cachecan load actions quickly from the local disk and may be shared among Bazel workspaces. - A remote cache is more commonly shared between many developers and generally includes cache hits for more actions.
- It is possible to use both a disk cache and a remote cache. The disk cache takes precedence over the remote cache when checking for cache hits. Action results are added to all available caches (internal, disk and remote) to allow for faster subsequent builds.
See the Bazel documentation on Remote caching, including a section on how a disk cache is essentially a "local" remote cache, which runs on the client's machine. However, in the terminology we use, remote cache hits do not include disk cache hits.
See the Bazel documentation on [strategies for improving the cache hit rate] (https://bazel.build/remote/cache-remote#troubleshooting_cache_hits).
- A local cache specified by
-
Maximize the number of remotely executed actions.
- Locally executed actions are limited by the client's machine resources.
- Remotely executed actions can leverage the resources of the remote execution service, which generally can execute more actions in parallel and does not suffer from resource contention on the client's machine.
- Action results are added to all available caches (internal, disk and remote) to allow for faster subsequent builds.
See the Bazel documentation on how to adapt Bazel rules for remote execution. Targets can be excluded from remote execution using the rule attribute
tags.
Critical Path
This section expands all the actions that make up the invocation’s critical path.
It is the longest-lasting chain of actions executed to complete the invocation, where each subsequent action depends on the output(s) of the previous one. Therefore they must be run sequentially.
The critical path is a lower limit on the clean execution time of this invocation. Even if the invocation had more cores available for parallel execution, it would not be able to complete any faster.
Known Issues
- The "Bazel Command" section of the "Configuration" tab may be incorrect and only applies to the same environment the original invocation was run from. Bazel does not explicitly include the command used to run the invocation so this reconstruction is a best-guess.