Web UI
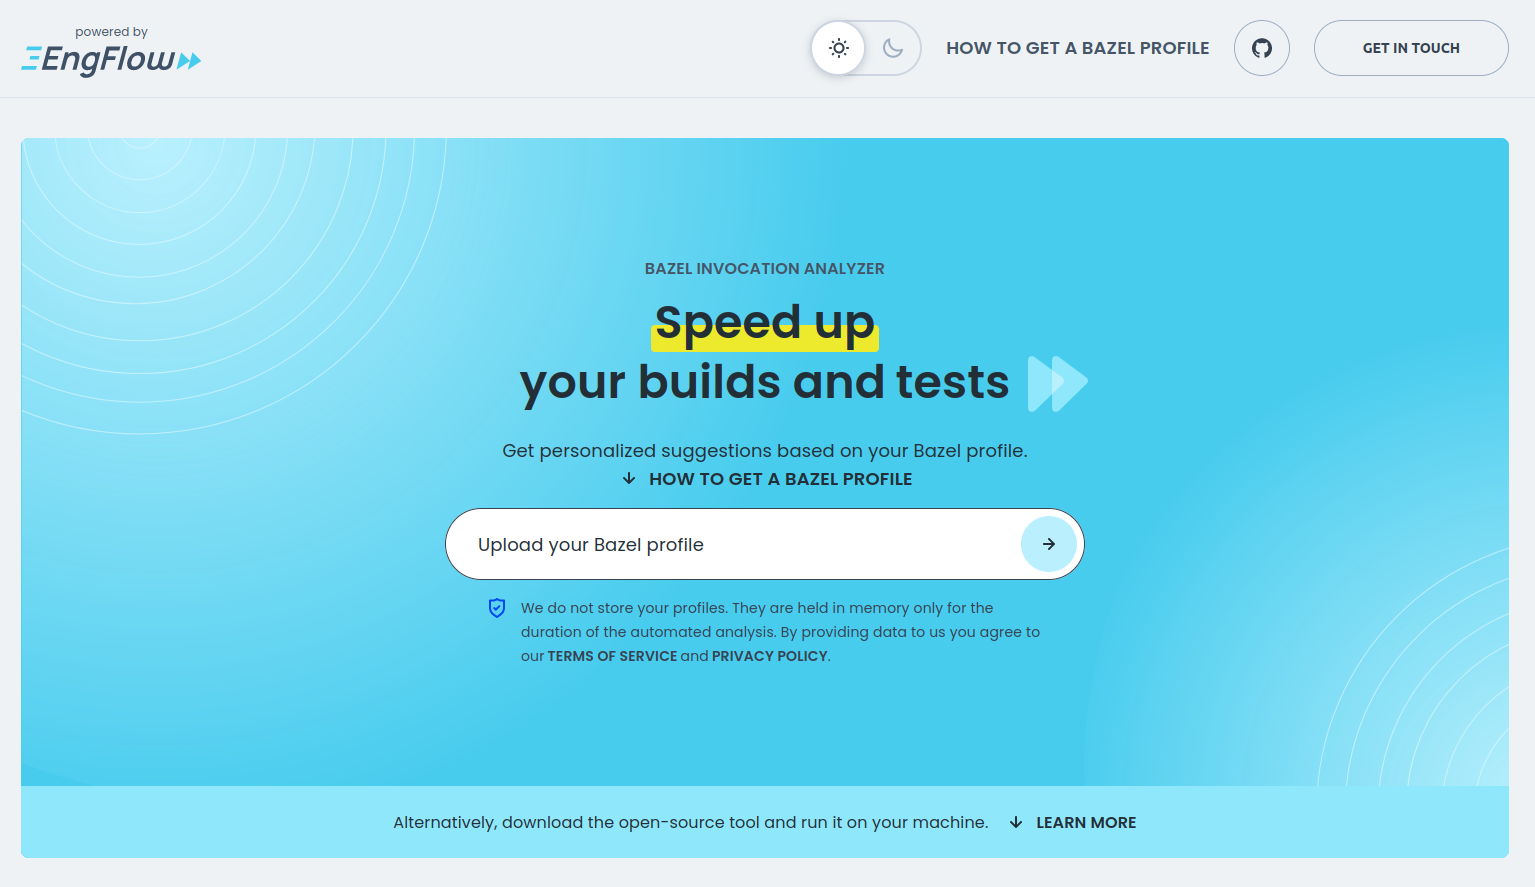
The Bazel Invocation Analyzer is integrated in the web UI available at https://analyzer.engflow.com. Bazel users can upload their profiles to receive suggestions on how to achieve performance improvements without having to download and install the command line tool.
1. Capture a Bazel profile
These instructions are duplicated on the Bazel Invocation Analyzer web UI.
For build-like commands, Bazel by default records profiles for later analysis. However, it often places the generated profiles deep in the output base and will overwrite them. These steps demonstrate how to get a fresh Bazel profile for analysis.
- Run
bazel clean. - This ensures that Bazel will not use the local cache to prune out potentially slow parts of your build.
-
You may skip this step if you would like to analyze the profile of a cached build. However, the analysis performed will be specific to the state of your local machine at the time of execution.
-
Run your build with the additional flags
--profile=/tmp/profile.json.gz--experimental_profile_include_target_label--disk_cache=--noremote_accept_cached
For example, you may build your entire codebase with the following command:
The Bazel profile will be written toBash /tmp/profile.json.gz.Warning: Using flags such as
--disk_cache=and--noremote_accept_cachedhelps reveal underlying issues during analysis. However, it will typically slow down your build. We do not recommend setting these flags on live builds.
2. Upload your Bazel profile to the Bazel Invocation Analyzer
Navigate to https://analyzer.engflow.com, then either:
- Drag-and-drop a Bazel profile from your filesystem onto the file input box labeled "Upload your Bazel profile".
or
- Click on the file input box labeled "Upload your Bazel profile".
- Using the file browser, select to the Bazel profile you would like to analyze.
- Click the button with the arrow to the right of the file input.
Note: The Bazel Profile Analyzer currently supports analyzing profiles that have a maximum file size of 250 MiB when uncompressed. If your Bazel profile is larger than 250 MiB follow the instructions use the command-line tool instead.
3. View analysis results
The web UI will navigate to the analysis results with a few notable sections:
Summary
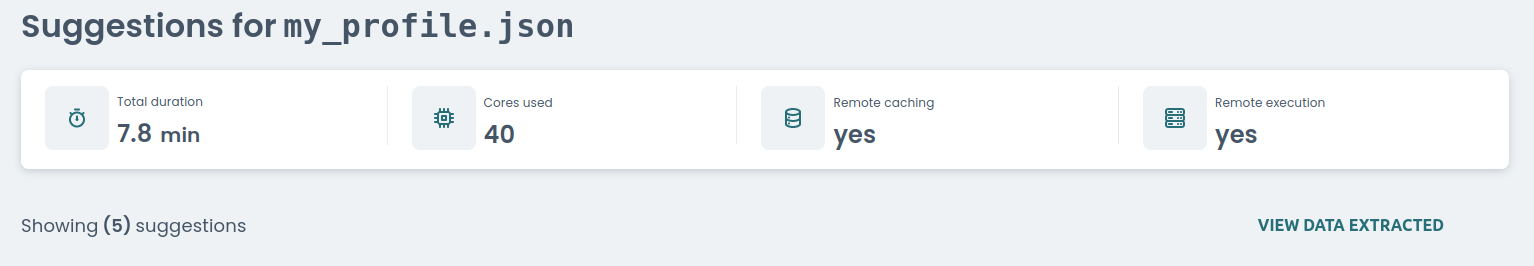
The summary section outlines some high-level details of the invocation such as the total duration, the detected number of CPU cores, and whether remote caching or remote execution were detected.
To view all the raw data used during analysis select the "VIEW DATA EXTRACTED" button which will take you to a separate page.
Caveats

Sometimes the Bazel Invocation Analyzer may restrict the amount of data shown or cannot make accurate predictions. If there is potential ambiguity in the analysis results any issues will be listed in this section.
Suggestion cards
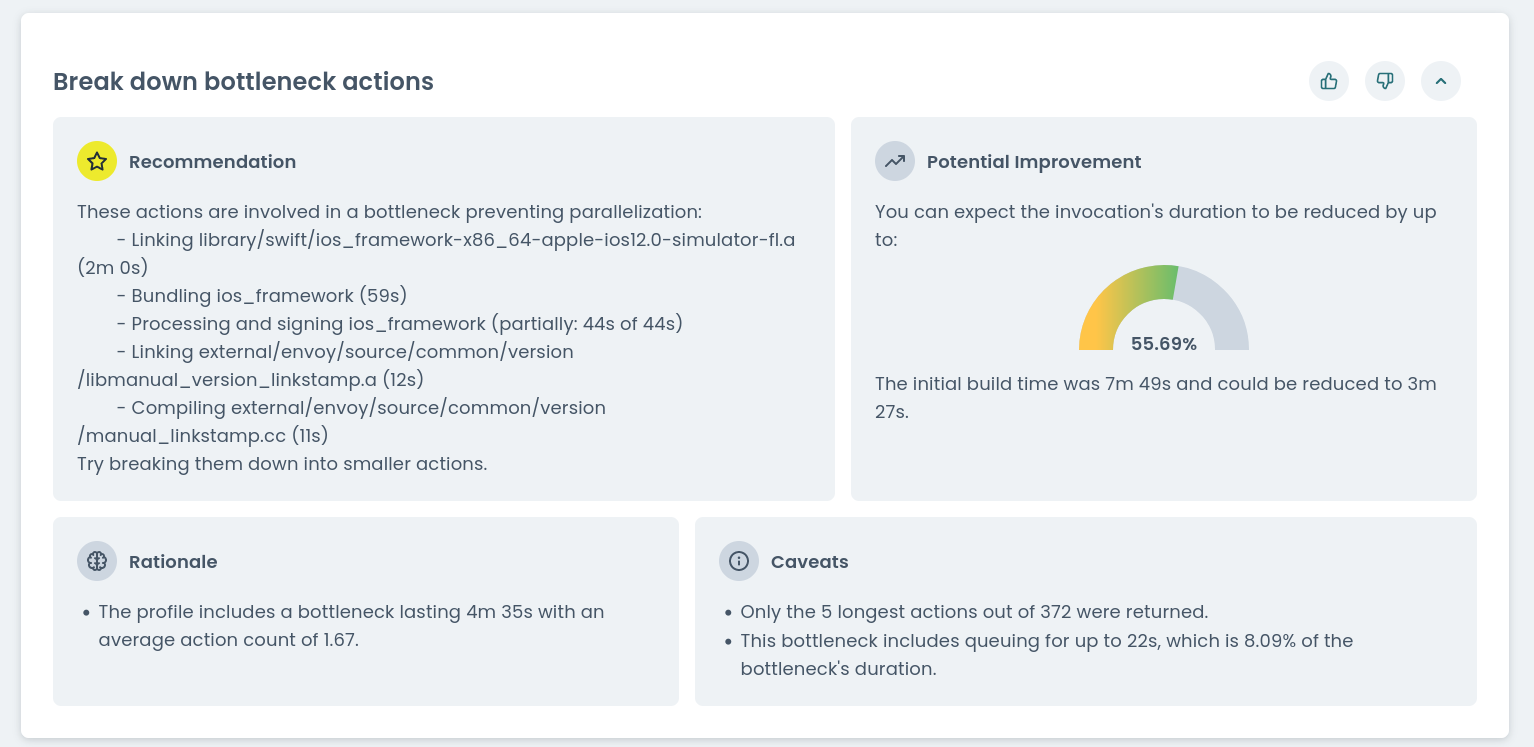
The rest of the page will contain a list of suggestions to speed up the invocation that was profiled.
Each suggestion will contain a recommendation specific to the profile that was analyzed. It should be actionable and has the potential to speed up your invocation.
Some suggestions include a potential improvement. This usually reflects the best-case scenario speed up that can be achieved. Suggestions are ordered from the most to the least potential improvement.
Some suggestions will provide a rationale that will give more details about why the suggestion has been made.
Some suggestions will contain caveats that are specific to that suggestion. As with the analysis caveats before, these outline potential ambiguities in in the analysis used to produce a suggestion.